Severe Weather Event and Tornado viewer
Project Date:
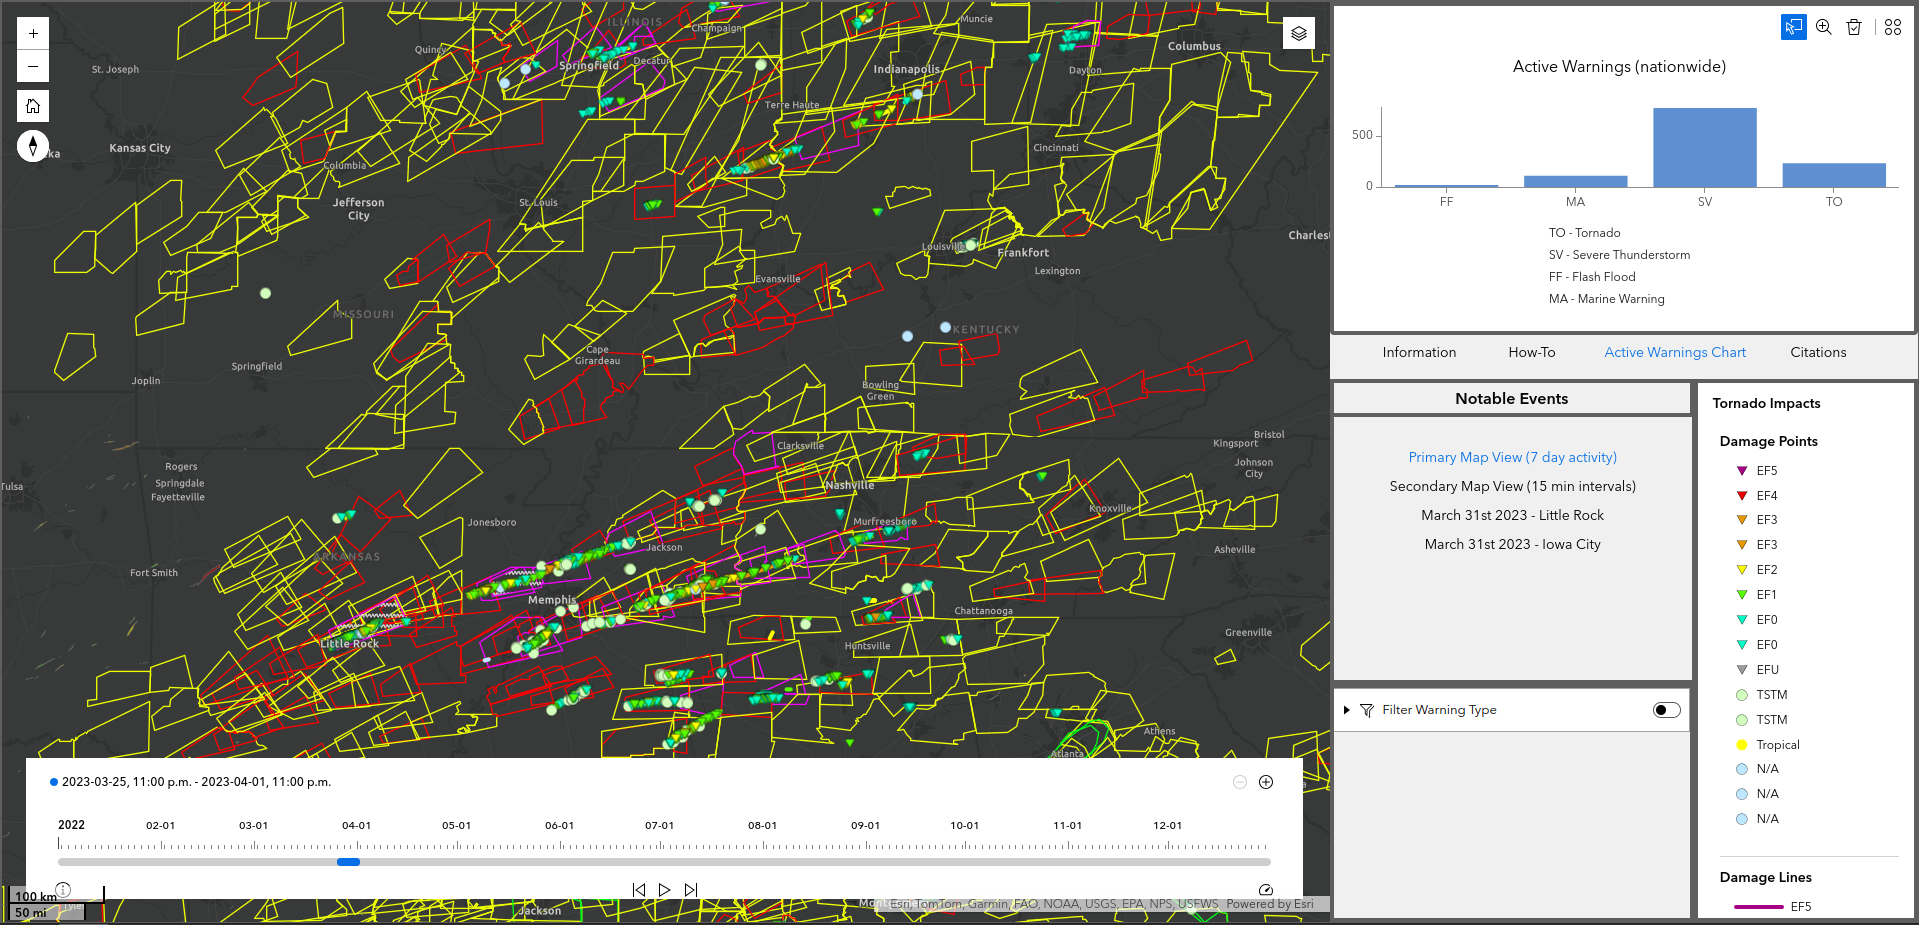
You can access the SWEaT Experience here
SWEaT is one of my favourite projects, born out of hours of rewatching
Skip Talbot's incredible
reconstructions of tornado events.
After reading that it took him substantial technical know-how and weeks to put together visualisations, I wanted to build something that'd enable anyone to get a similar product within a few minutes.
The National Oceanic and Atmospheric Administration's Damage Assessment Toolkit and backend provides damage imagery and severity which allows us to track where the tornado was and how strong it was at any given moment.
I also overlaid a storm-based warning dataset sourced from the Iowa Environmental Mesonet. These warnings have a timestamp in a non-ISO8601 format, which I cleaned up using a Python script I wrote in QGIS.
I ran into a few limits with the software, the biggest was being unable to change the timeline widget's time range based on filtering of features. If I was able to, I could've made the entire warnings dataset available in tandem with a date filter. The views function also felt hard to work with, but I was also in a rush when developing this project so may have found only the quick and messy solution.