Urban Growth Cellular Automata for Surrey, BC
Project Date:
With a project partner, I developed a Cellular Automata based model to predict urban growth in Surrey
Cellular automata models use the properties of their neighbours to determine their state at each step, with the set of properties governing a change from one state to another being called a transition rule. Urban growth models often make non-urban cells transition to urban cells once a certain amount of urban neighbours next to it are urban.
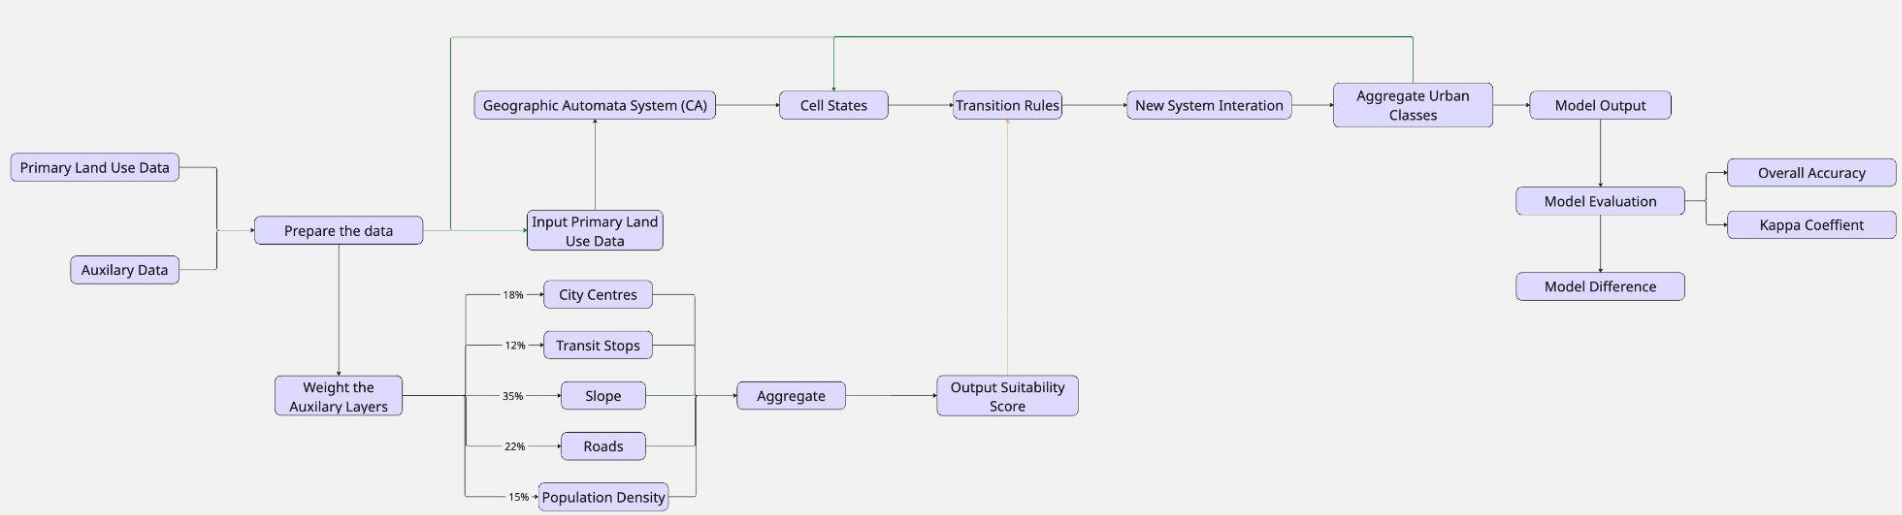
Our urban model was developed ArcGIS using a newly developed plugin by Alysha van Dunhoven PhD. We wanted to use a suitability map because it allows us to incorporate many variables at once. However, while other CA software is able to directly vary the amount of neighbours required to transition based on a suitability map, this feature was not explicitly available in the plugin.
To get around this, we came up with what I think was a clever solution. We first sorted hopeful cells into four different pseudo-states based on how many urban neighbours they had and matched the cells to a suitability map.
We then made three suitability maps for three scenarios, where we varied the weight of existing population centres. This represents a willingness by the city to densify existing hubs (high weights), or an unwillingness which causes sprawl (low weights).
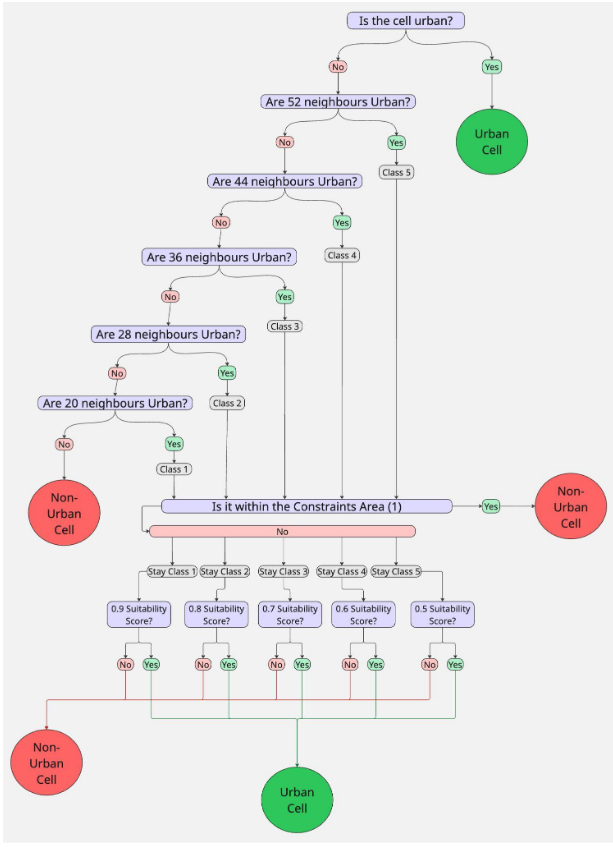
Classes with a low amount of neighbours could still transition provided they scored well on the suitability map, whereas cells with high neighbour counts had a lower score required to end up transitioning.
Evaluation
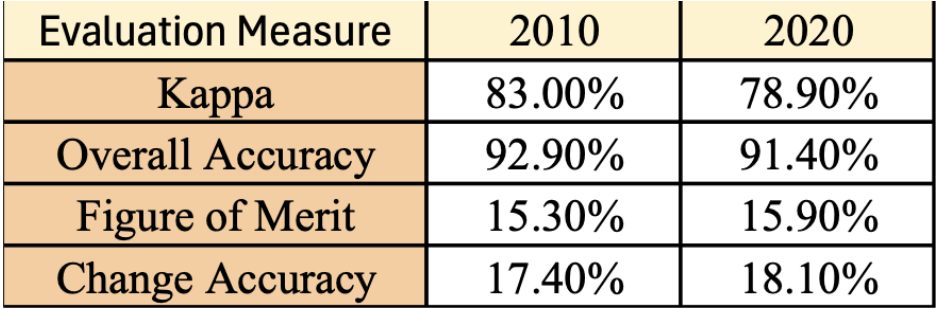
A 19% change accuracy might seem low, but we were satisfied by this result because urban growth is governed by complex processes — it's hard to model how cities make their decisions with fixed rulesets.
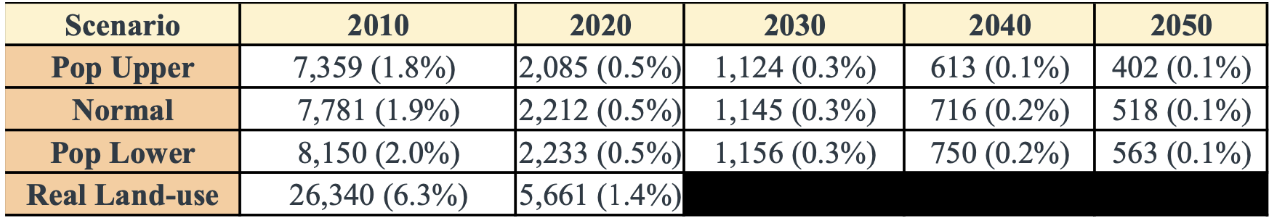
Our model can't adjust for changes to factors over time, so it has a stable growth posture and underpredicts growth in the first two decades. The figure below shows the amount of cells that changed from non-urban to urban in each timestep, with the % of total cells changing given in parentheses.
It was great to be able to learn how to work on a complex GIS project with others, and I was able to learn about a few things that I can carry forward to other projects
Check out the GIF below if you'd like to see our model run :)